Free, no sign-up, nothing stored unless you ask us to send it. Built for executive directors, program managers, and grant writers, so the case you already know how to make lands with a board, a funder, or a legislature.
Each answers a question you have probably already been asked, and gives you the number with its source attached.
PeopleCostsTime
CalculatorLive
Turnover Cost Calculator
Enter your frontline numbers and see what turnover costs, in dollars, in cases that change hands, and in the figure that tends to end the conversation: how many families will meet a new worker this year.
Direct replacement cost, and the share above a healthy turnover rate
Benchmarks built in, if you do not know your own rate yet
Every source cited on the page
12% vs 30%
The healthy ceiling against the national estimate for child welfare.
National caseworker turnover of roughly 30% per year, with a range of 20–60%, per the Child Welfare League of America; Casey Family Programs identifies 12% or below as healthy.
Eighteen questions across six areas, about five minutes. You get a score, a breakdown by area, and the three gaps most worth closing first, framed around what each costs your team in hours and your families in waiting.
Website, intake, case records, training, reporting, and safety
Scored results with a plain read-out you can hand to a board
Nothing is stored unless you ask us to send your results
85% / 52%
Organizations bracing for more demand, against those with little cushion to meet it.
85% of nonprofits expected demand to rise in 2025 while 52% had three months or less of cash on hand (Nonprofit Finance Fund, 2025 survey).
Your state against national benchmarks, with organizations on top and the statistical layers underneath, so the picture reads as “here is the need, and here are the people meeting it.”
Filter by state, service, and digital presence
Every layer carries its source, vintage, and last-verified date
Links straight through to the state’s directory page
1,032
Children’s advocacy centers and state chapters mapped nationally.
NCA member Children’s Advocacy Centers and PCA America state chapters, NCA directory, retrieved August 2026.
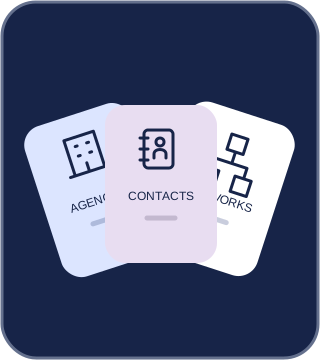
Who runs the system in your state, who administers the money, what the rules are, and where the state publishes its data. Utah is live as the first state page, hand-verified, every fact dated.
System contacts: child welfare, behavioral health, CJCs, coalitions, licensing
Money: VOCA, FVPSA, VAWA STOP, CBCAP and state-only streams
Listings are system-level by design. Domestic violence entries appear at the coalition level only, never individual shelters or addresses.
In development
Being built next
DeadlinesTimingEligibility
TrackerIn development
Funding Deadline Tracker
A free, filterable calendar of grant deadlines that actually apply to this sector, filtered by vertical, eligibility, and how soon they close, so you are not reading a federal firehose to find the four that fit you.
Filter by vertical, eligibility, and 30/60/90-day window
Every opportunity carries a status and a verification date
Deadlines, eligibility, links, not a grants database
69% / 46%
Organizations reporting cuts, and leaders worried about closing.
CEP’s 2026 survey found 69% of nonprofits reporting cuts from at least one source and 46% of leaders worried about closure. NFF’s 2025 survey found 84% of government-funded organizations expecting cuts.
Tell us what would actually help.
These tools exist because directors told us which questions kept coming back. If something here is close but not quite what you need, or the state you work in should be next, say so, and it goes on the list.
About these tools. Every figure on this page is quoted from the tool it describes or from that tool’s specification, with its citation attached. Where a number is not yet verified, the tool shows a dash rather than an estimate. Corrections: hello@mopheadmedia.com.